Météo France Hackathon

Jonathan Lurie
The Setup
The event took place at the Météo France research pole in Toulouse (south of France) with the topic “The Climate in Data”. Teams had two days (really more like a day and a half) to build a project using beta climate projection datasets made available by Météo France and the DINUM.
A few days prior to the hackathon, Météo France organized a team-formation meeting so that participants attending solo could get to know each other. This is how I met Florent Cornet (engineer in energy and founder of Seracle), Marie Jamet (freelance data journalist and science enthusiast) and Mareva July-Wormit (weather scientist at Météo France, also turning into an energy specialist). As a scientific software developer and weather and climate data enthusiast, I immediately had a very positive vibe about our fairly eclectic team.
The first day was also a humbling introduction to the data. A very large amount of data. Fortunately, a group of mentors from Météo France was always around to help us navigate through the many climate projection models, scenarios, bias correction methods, grids and acronyms.
The Design Process
Within the first couple of hours, we were already drafting the goal of our project, how we would build it and which datasets it would use. I knew I could quickly set up the foundations of a map-oriented web app with data layers. We leveraged Mareva’s weather expertise to carefully pick the right datasets and make sense of them. Florent used his knowledge in sustainable energy to frame a list of relevant indicators, focusing on wind turbines and solar panels, and Marie used her experience in data journalism to adjust the narrative and contribute to the Python data processing scripts.
Mentors regularly stopped by to check how things were going and often shared valuable insights. Shout-out to Lola Corre and Sam Somot for letting us pick their brains. This is also where I learned about the TRACC, designed by the French government, as well as some of its strengths and limitations.
Our project was now clear:
a web app that provides indicators relevant to energy consumption and production to help the solar and wind power industry identify regional strengths and weaknesses for future developments.
TRACC, scenarios, and design choices
The TRACC is not a climate model but an official reference for how to adapt to rising temperatures. It defines milestones in degrees Celsius (+2°C, +2.7°C, +4°C) without tying them to a specific calendar.
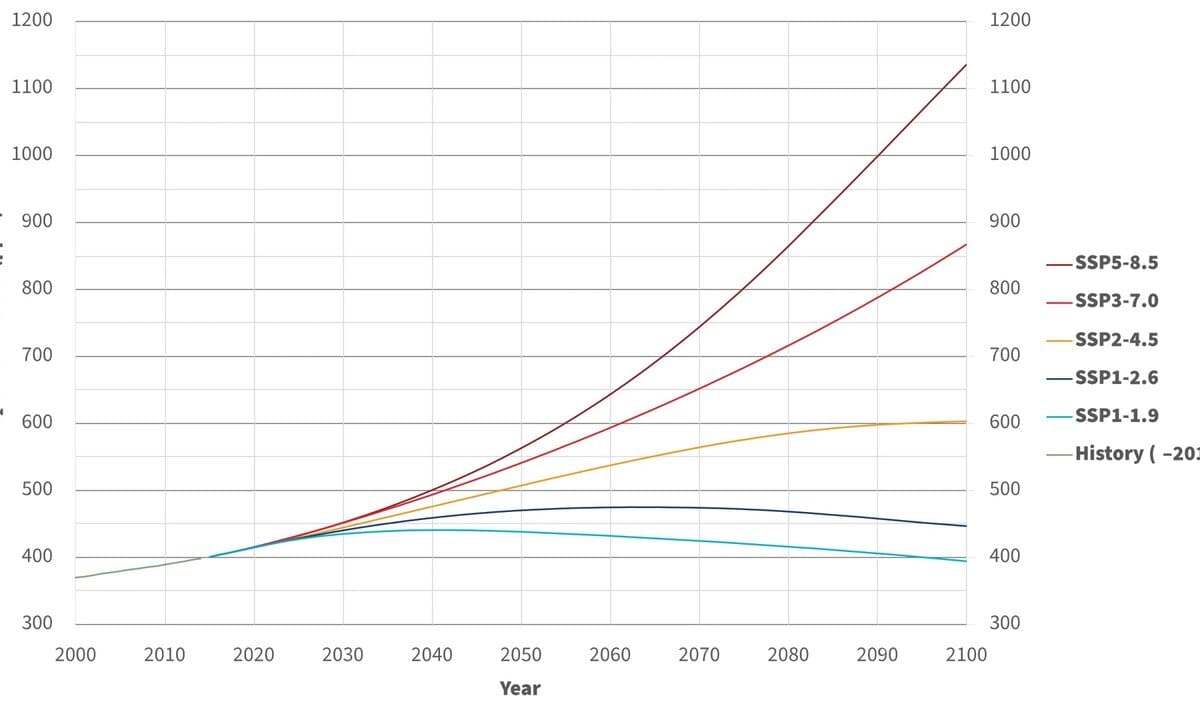
Climate scientists work with multiple possible futures, known as shared socioeconomic pathways (SSPs), which lead to different timelines for reaching these milestones. While it would be great to support all of them, the 48 hours of the hackathon pushed us to make some choices. The main one was to replace a traditional timeline with a global warming cursor expressed in °C.
This approach makes the interaction more flexible and directly TRACC-oriented for decision makers in France, who will have to adapt to a certain temperature rise rather than a specific calendar.
Choosing a model, picking relevant variables
Our app targets the renewable energy industry, specifically wind turbines and solar panels. We focused on the following variables:
wind speed
incident solar radiation
mean temperature
We also computed several indicators:
Degree Day, measuring heating and cooling demand
number of days per month below 0°C
number of days per month above 30°C
All available prediction models for mainland France and Corsica are driven by the SSP3-7.0 scenario, which represents a challenging but realistic future pathway.
Some models offer different spatial resolutions depending on the variables, which complicates the computation of composite indicators. Based on these constraints, we chose the regional climate model CNRM-ALADIN64E1 forced by the global model CMCC-CM2-SR5, with bias correction using ANASTASIA and SAFRAN reference data.
In short, this results in daily raster datasets from 2014 to 2100, at roughly 12 km resolution over France and Corsica.

Features
Since the entry point of our app is the TRACC milestone in °C, we only used the years corresponding to these milestones, plus a reference situation in 2005: +1.5°C, +2°C, +2.7°C and +4°C. Each milestone is an average of the surrounding 20 years.
Because renewable energy production is highly seasonal, all variables were computed on a monthly basis. This allowed us to add a secondary slider to navigate through the seasons.
For visualization, I suggested a web map with data-driven raster overlays. I customized a tiling pipeline originally built for Météo France ARPEGE forecasts and adapted it to GeoTIFFs produced from NetCDF data. The visualization is built on top of Maplibre GL JS and allows both clear rendering and precise data picking.
The Stack
We relied on Python for data processing (GDAL, Xarray, Pandas, RioXarray), custom GDAL-based tiling, Maplibre GL JS for visualization, and a lightweight cloud setup (Hetzner Cloud with Coolify) for hosting.
Nice-to-have improvements
Two days was enough to show the potential of these datasets, but it also left us with many ideas for improvement:
include more climate projection models
add intermediate °C milestones
add date information per model
improve colormaps per indicator
add another interpolation axis
It’s a Wrap!
At the end of the second day, our project was shortlisted by the jury with eight other teams to make a longer demo the next day. We did not win the final competition, but that’s really no big deal.
I personally learned a lot about climate prediction during this event and am still unpacking the amount of information I picked up from my team and the mentors.
The datasets used during the hackathon were a beta version prior to a public release. While we focused on renewable energy, many other topics could be addressed using climate projections, from flood prevention to urban heat islands or changes in agriculture practices.
It was a great event and I’m very proud of our team for what we managed to produce in such a short amount of time.
Author
Career
Interested in working in an inspiring environment and joining our motivated and multicultural teams?