Anything is 3D
Since we invented cave drawings, we are used to translate the three dimensional reality into a schematic representation of it. First these drawings were very simple. Several thousands of years passed until finally, the first realistic 3D paintings appeared in late middle age.
Geographic information is running through a similar process: We abstracted the information with icons and symbology on maps, which got printed on flat folding paper and then did the same on the web. Have you ever thought about taking your data and tools to a 3D visualization, on the web?
Maybe you have data that has only a part of 3D information, or you have tools that take the third dimension into account only in a very abstract way, as an attribute or even as implicit assumption.
What if you could see this data on a globe, or in a realistic representation of a mountain valley? What if it would be easy to spread it, no more needed than a common browser?
What if you could analyse your data, combine it with other data, and get insight into it in a completely new way?
Or maybe you want to streamline your 3D data or digital twin to a wide public in a very performant and maintainable way? Let them experience some virtual reality for your project context?
The value of your data and tools in 3D with Cesium
Depending on your project, the added value for streamlining your data in 3D on the web can boost the meaningfulness of your data than just staying with a conventional, two-dimensional map.
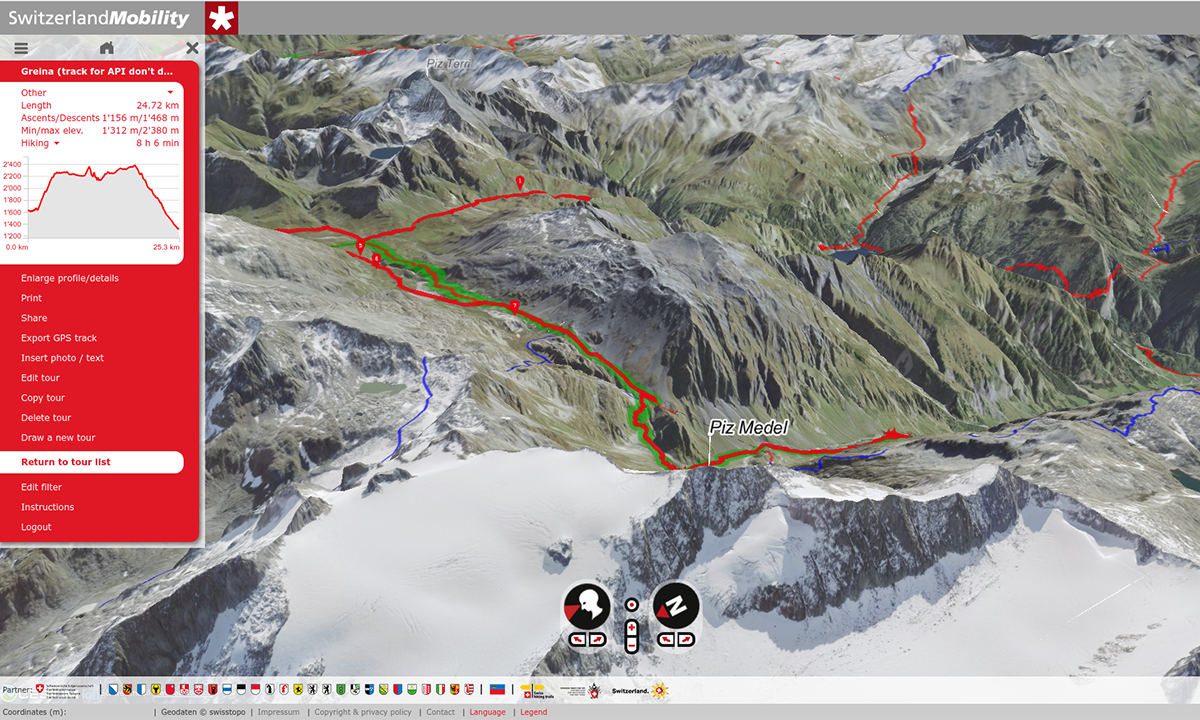
Cesium’s 3D visualization lets the user experience a much more realistic view of your data, for example regarding weather conditions or the steepness of a path in a hiking tour. As an example, a user can understand much better the difficulty of the tour if he sees the steepness of the path in a 3D visualization.
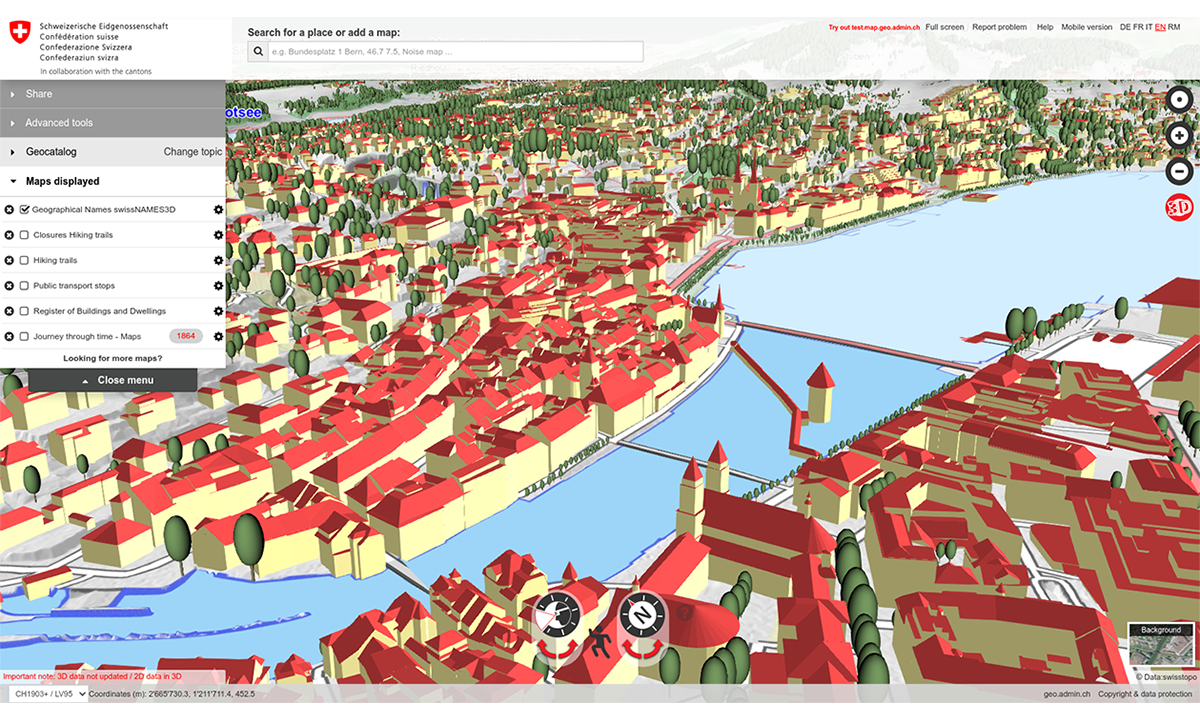
3D globes can also help planning and communicating infrastructure projects across several stakeholders. For example, very precise height models can be integrated into a 3D web visualization with no performance loss at all, making it possible to realistically communicate on construction work and utility management.
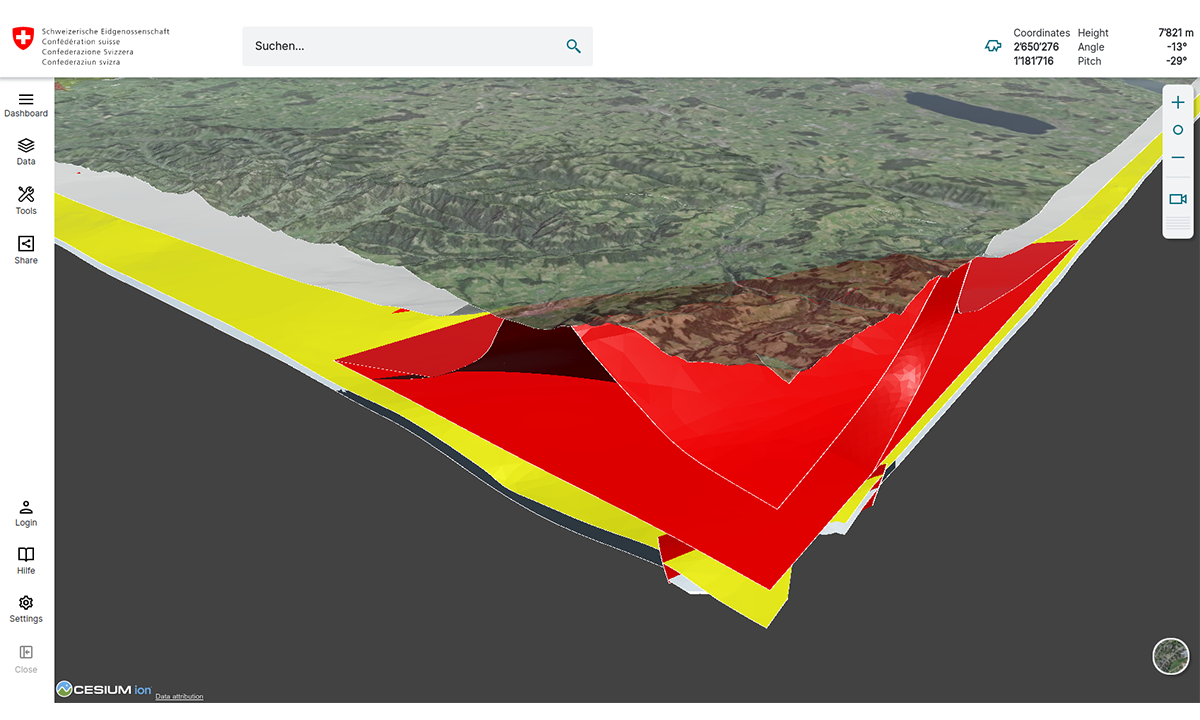
3D visualization does not need to stop here though. It can offer a lot of analysis options like slicing, measuring in space, annotating, flight simulation, data management etc. Of course, you can import your BIM models and digital twins as well.
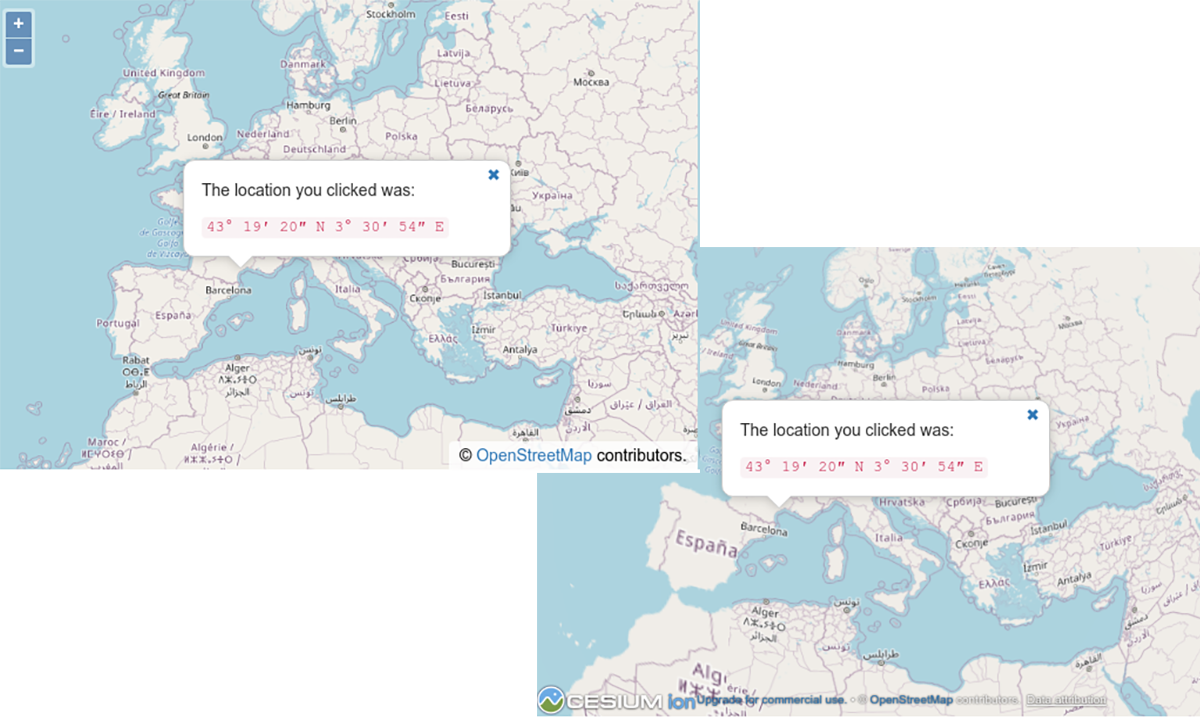
And finally, your 3D application can be combined with conventional 2D maps, synchronizing perfectly together in one single web application and showing your multidimensional data in any context.
Get your 3D CesiumJS project
With CesiumJS as a 3D globe and Camptocamp’s very early-on experience with it you’ll be able to deliver your own tailored project to your target audience, maintain it and spread it further on.
We have been working since 2014 with Cesium Inc. on many 3D projects in the domain of tourism, geology, 3D analysis, business intelligence, etc.
Followed you can find some examples:
We would be happy to get in touch with you and discuss your project ideas.
Career
Interested in working in an inspiring environment and joining our motivated and multicultural teams?
